
Home / Case studies / Breakout stress analysis
Tech-Log™ · Rock mechanics · stress
In-situ stress from
borehole breakout
Borehole breakout, the ovality a borehole develops perpendicular to the maximum horizontal stress, is visible in oriented acoustic televiewer images. Interpreting it hole by hole and combining the results into a multi-hole field stress model gives mine planners a stress orientation they otherwise rarely have.
The question
The folding or faulting of a rock mass is a definitive indicator of its inherent stresses, yet mapping the orientation or magnitude of those stress fields is challenging, particularly in apparently competent formations away from major structures. Standard drilling and core logging practices yield minimal field stress information, and what is gathered still needs to be defined in orientation or magnitude.
A poorly defined field stress model can severely affect mine design and operational safety. What was needed was a way to extract stress information from data that is already being acquired.
Breakout analysis of ATV images already acquired for structural logging produced the orientation and relative magnitude of the maximum horizontal stress along each hole, feeding a field stress model for safer, more productive mine planning.
- DataOriented acoustic televiewer (ATV) amplitude and travel-time images
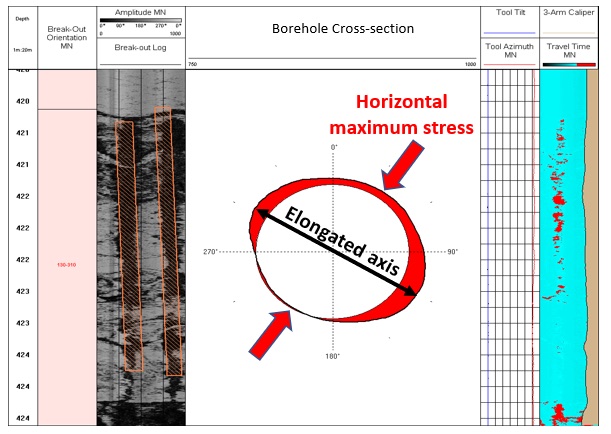
- IndicatorVertical to near-vertical breakout perpendicular to maximum horizontal stress
- OutputsMaximum horizontal stress orientation, relative magnitude, rotations along the hole
- ScaleSingle-hole analysis combined into multi-hole field stress models
What we did
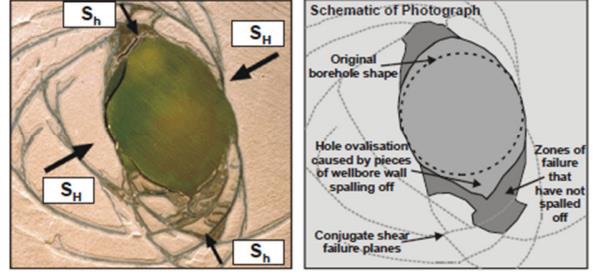
Acoustic televiewers are primarily deployed to map planar geological and structural features that intersect the borehole, but they can also map vertical to near-vertical borehole breakout where present in the wall. Breakout occurs when the removal of the core creates a cavity: the field stress in the rock mass acts on the cavity, introducing ovality proportional to the magnitude of the horizontal stress, up to mechanical failure of the wall rock at points perpendicular to the maximum stress orientation.
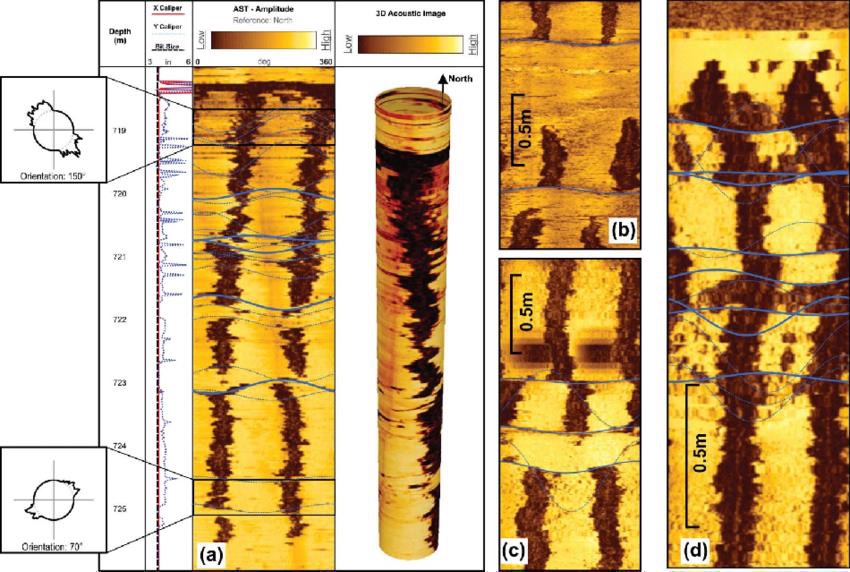
Because the ATV image is captured in-situ and oriented, the maximum horizontal stress orientation is interpreted directly from the breakout occurrences in the image. A relative magnitude is inferred from the degree of deformation of the cavity and the horizontal extent of the breakout across the image.
The entire image can be interrogated for breakout occurrences large and small, so rotations in the maximum horizontal stress are interpreted along the borehole length. The 360-degree image also lets the interpreter distinguish breakout from drilling-induced features such as washouts and key seats, adding certainty to the interpretation.
What it changed
ATV images are generally used for geological and localised planar structure interpretation. Including breakout analysis in the workflow extracts the maximum usable information from data that has already been paid for. Combining single-hole breakout analysis into more extensive field stress interpretations deepens understanding of the rock mass before mine development, for safer and more productive planning and operations.
- Maximum horizontal stress orientation from every hole with ATV coverage
- Relative stress magnitude from breakout geometry
- Stress rotations identified along the borehole
- Breakout separated from washouts and key seats with confidence
The ATV generates images by transmitting ultrasound pulses via a rotating mirror and recording reflection amplitude and travel time from the borehole wall. Amplitude maps acoustic impedance; travel time maps borehole diameter, and therefore ovality. An onboard fluxgate magnetometer array and accelerometers orient every scan line to magnetic north or borehole high side, so breakout azimuths are true orientations.